On August 12, 2026, Earth and the Moon align to produce a total solar eclipse over northern Spain, something the peninsula hasn't experienced in over a century. We visualize the orbital geometry, lunar nodes and the shadow's path that make it possible.
Looking directly at the Sun during an eclipse can damage the retina in seconds, painlessly. We use illustrations to explain the different types of eclipse, what happens to an unprotected eye, and the only moment it's safe to watch without a filter.
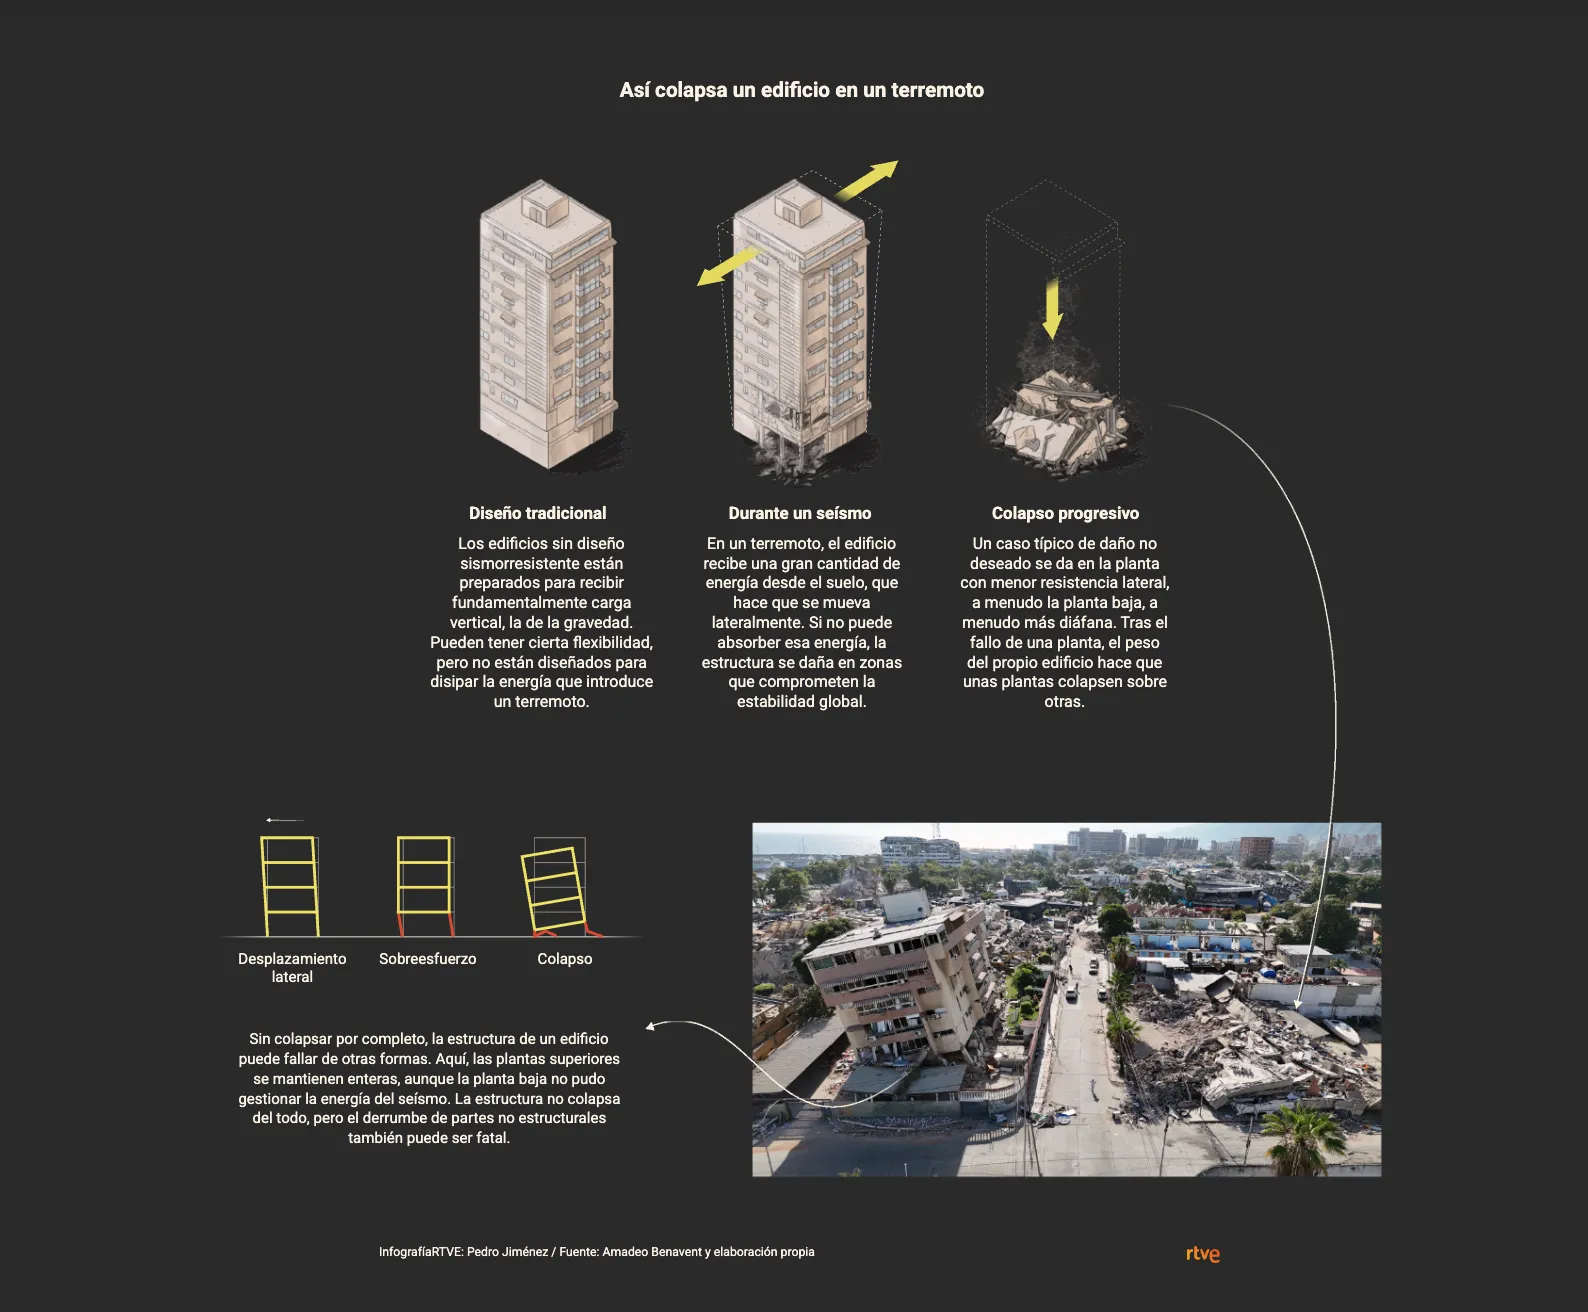
Using the Venezuela earthquake in the La Guaira area as a case study, we use Copernicus-based maps, satellite imagery and infographics to explain why two buildings can respond so differently to the same earthquake, and what construction and prevention challenges remain in Spain.
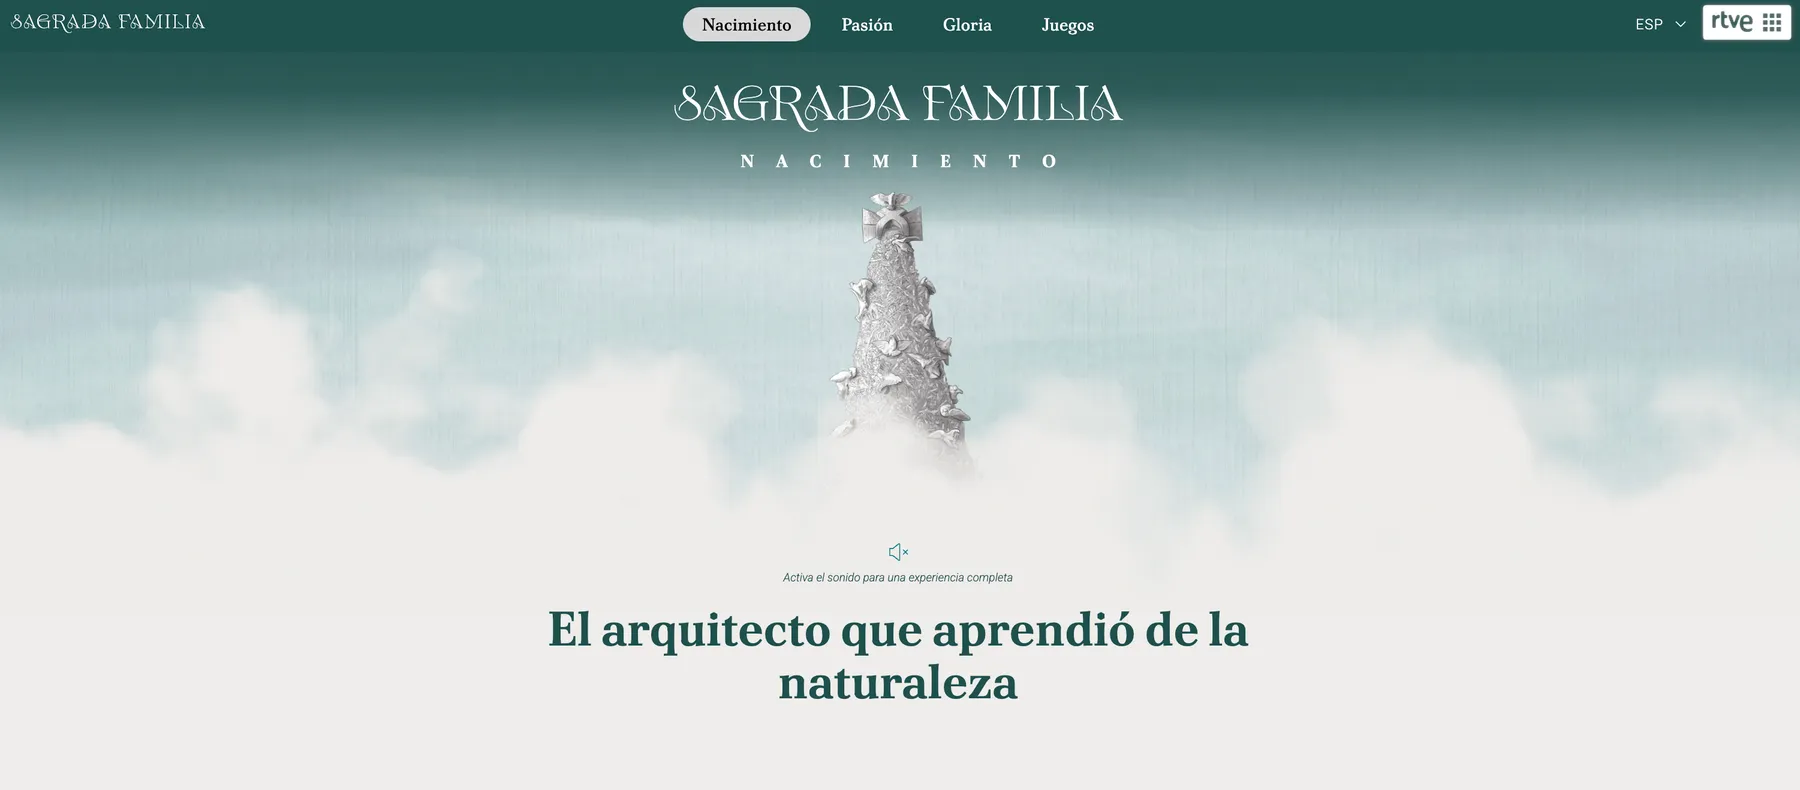
Through three chapters -Nacimiento, Pasión and Gloria-, this interactive special explores the history and secrets of the Sagrada Familia on the 100th anniversary of Gaudí's death, with video, infographics, illustration and games, in Spanish, Catalan and English.
More than half a century after the last Apollo mission, we break down Artemis II's round trip to the Moon: how long it will take, what the crew's journey around our satellite will look like, and the parts that make up the rocket and the Orion spacecraft, through a 3D animation.
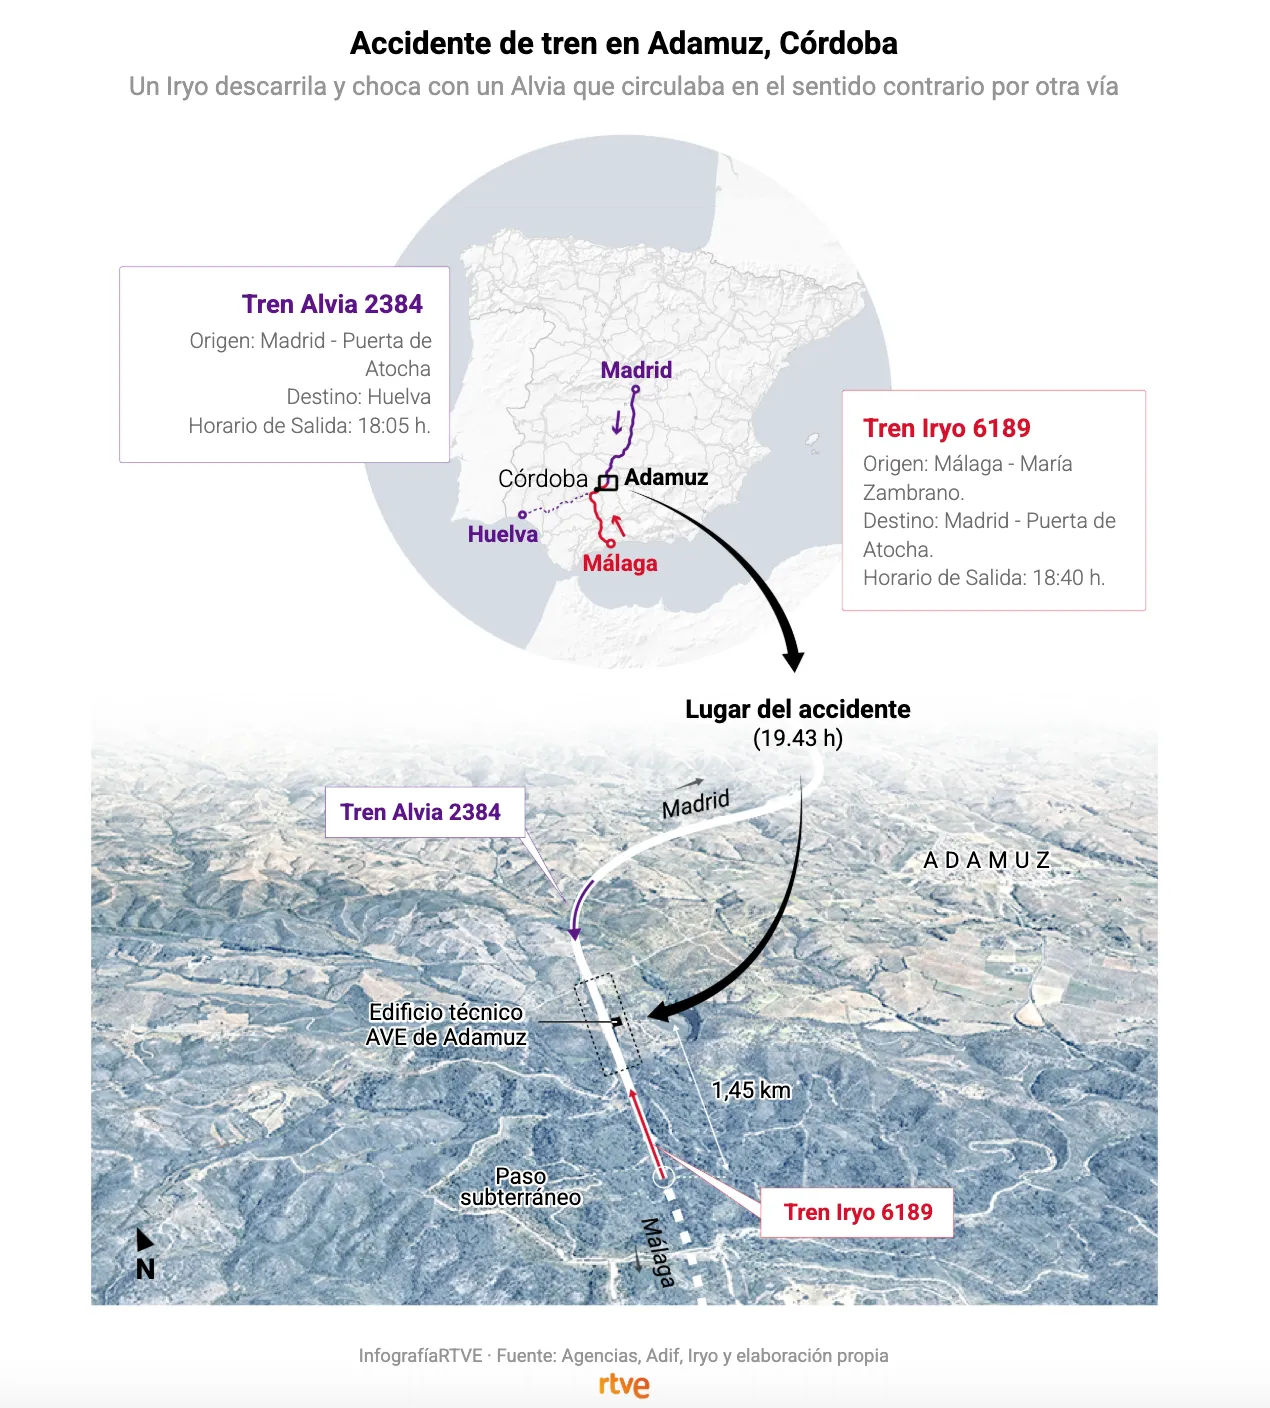
After the collision of two high-speed trains in Adamuz (Córdoba), which left more than 40 dead and around a hundred injured, we used maps and graphics to visualize what is known about the location and the impact between the Iryo and Renfe trains.